Sharing helps us build more free tools
Find a quadratic line of best fit with this free online quadratic regression calculator.
The quadratic regression calculator can be used to fit a quadratic equation to a set of input data points.
The raw input data set is shown as a scatter plot behind the line of best fit.
The quadratic regression calculator will find a line of best fit according to the value of the order parameter.
The fit is found using the least squares method. The least squares method finds a regression fit that minimizes the distance between input x values and observed y values.
Statisticians sometimes describe quadratic regression as a type of linear regression. Fitting a quadratic equation to a set of input points requires solving a set of linear equations.
How to Perform Quadratic Regression
Upload your data points using the input at the top of the page
Select the response variable y and the predictor variable x
Download your chart using the button on the top right of the chart
Quadratic regression model
The quadratic regression calculator fits a quadratic regression model to input predictor variables.
It's easiest to look at this with examples.
How to Find the Best Fit Second Degree Polynomial: ax^2 + bx + c
The chart below shows a second-order fit found with the online quadratic regression calculator.
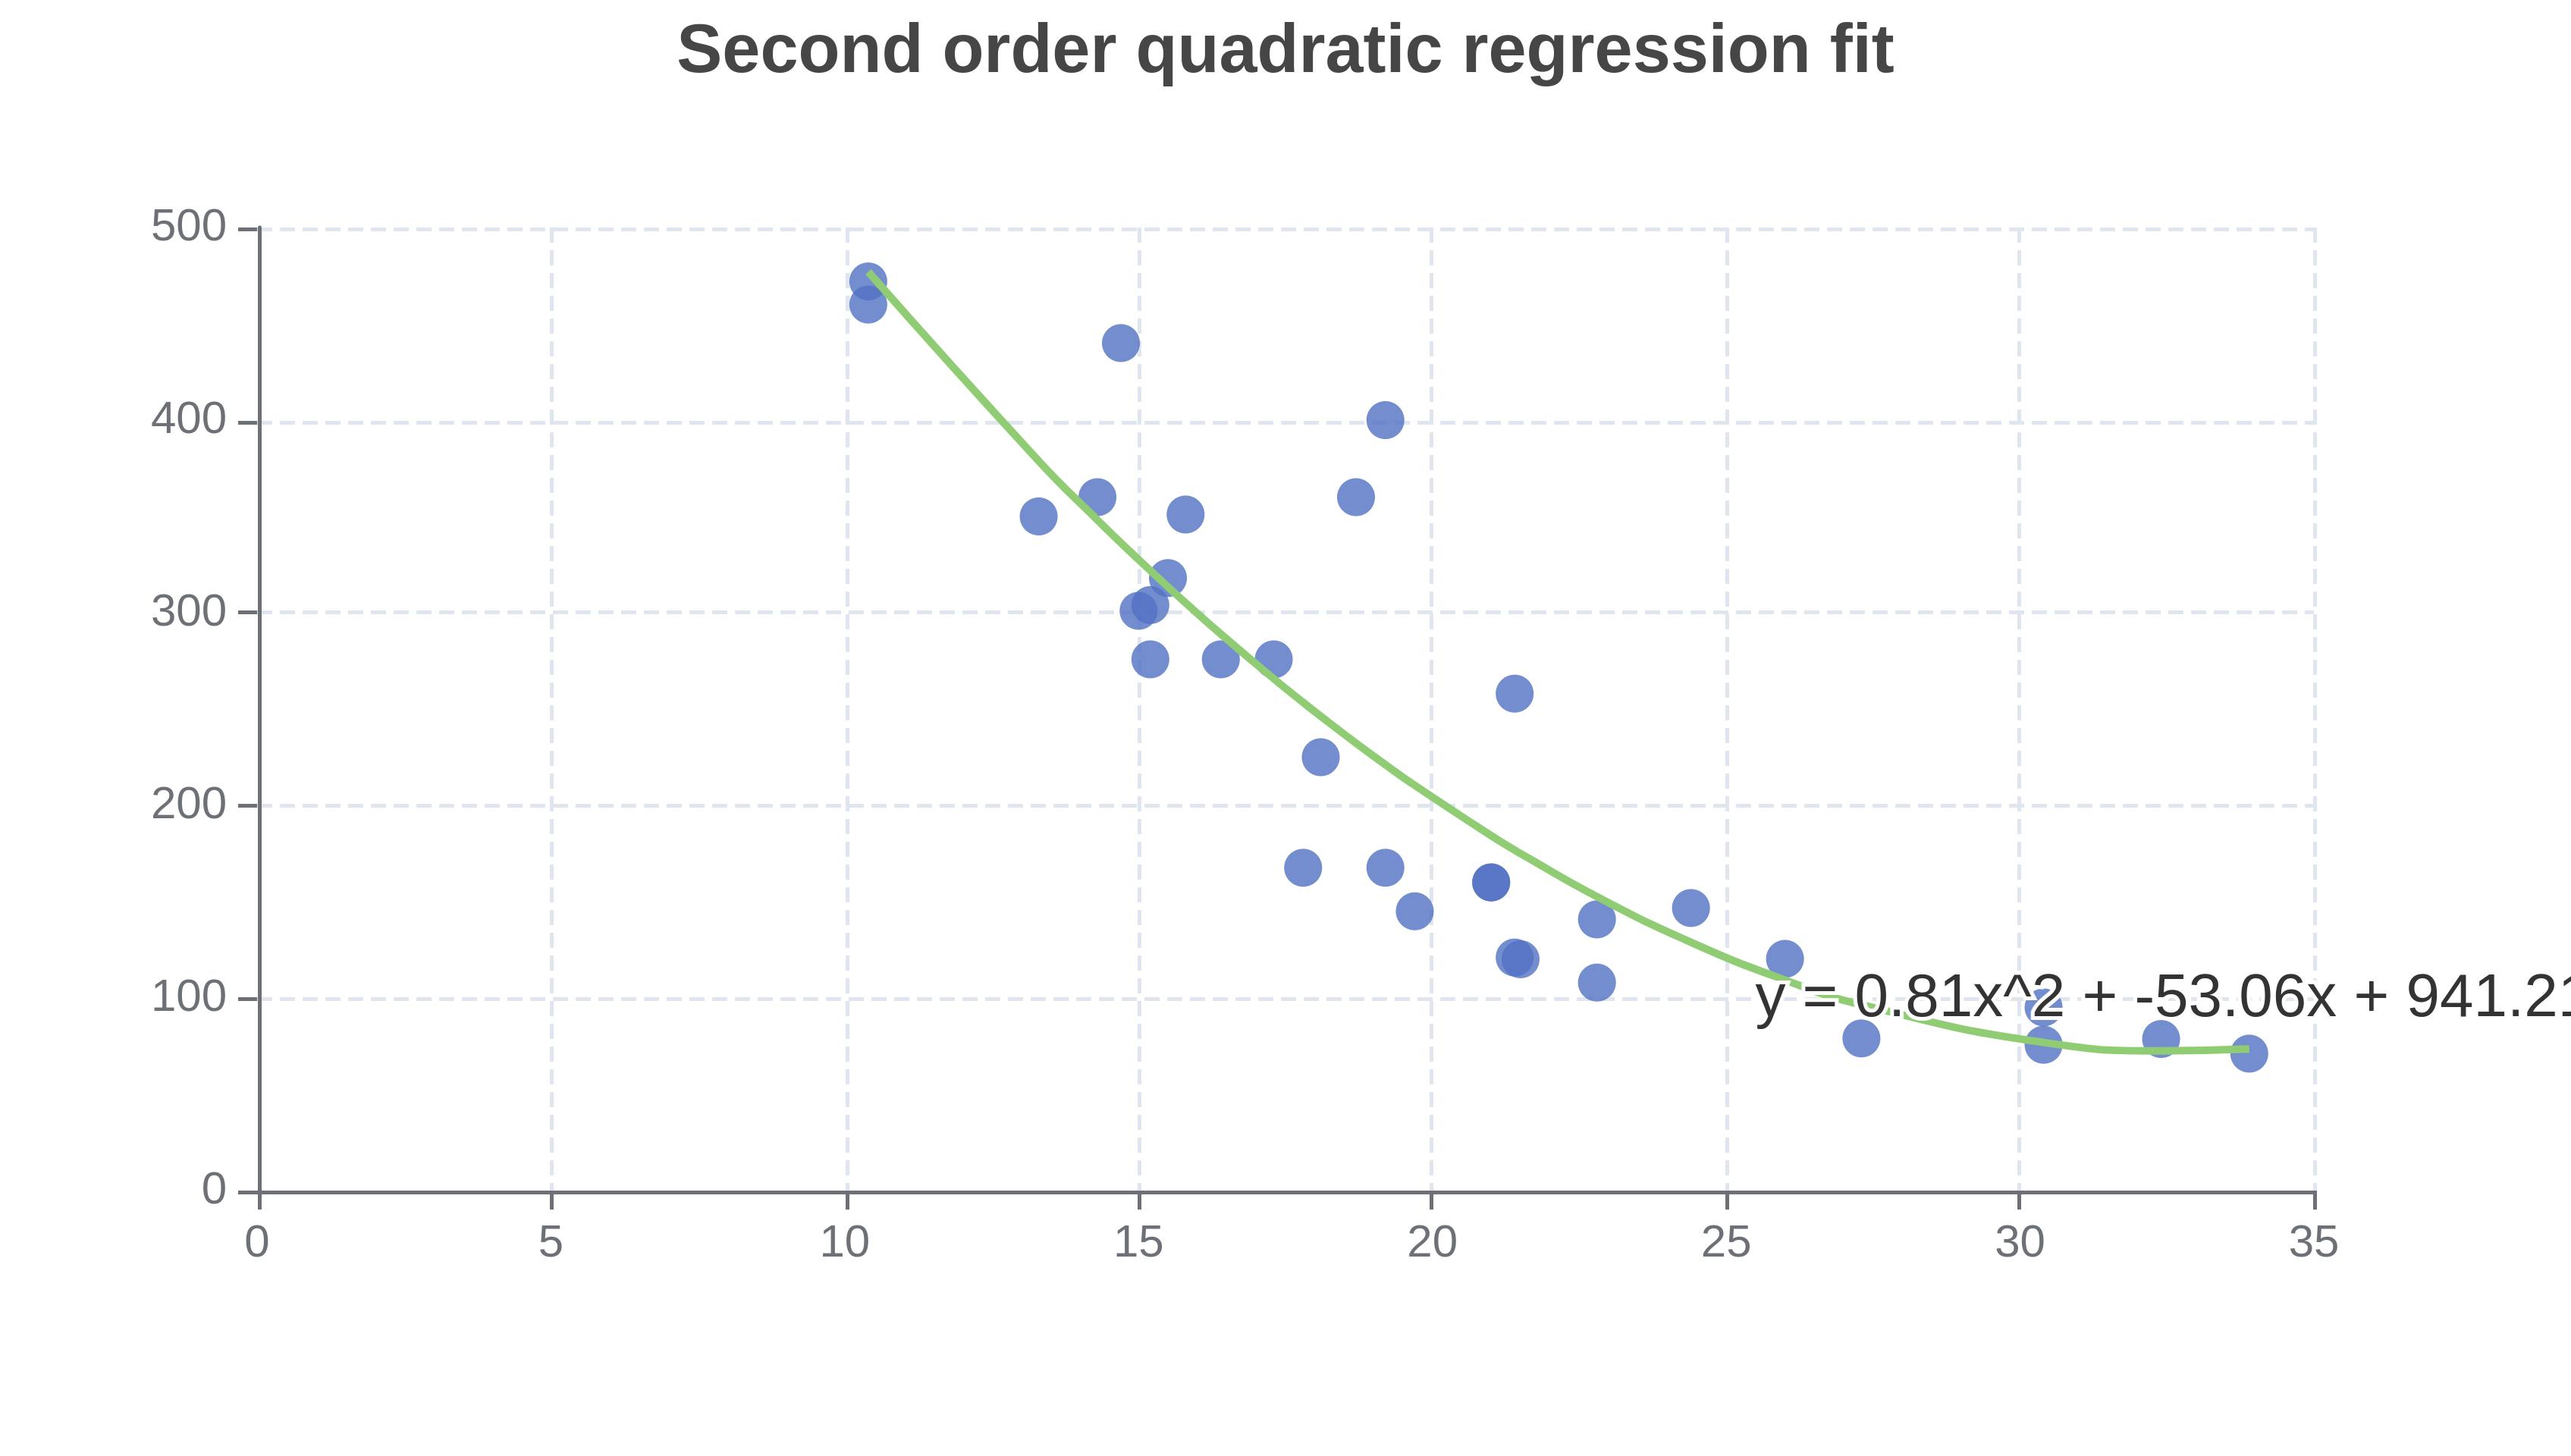
The quadratic regression calculator found a fit of y = 0.81x^2 - 53.06x + 941.2. Notice how the biggest power of x is 2 in the x^2 term. The order parameter was 2, so the quadratic equation fits a second order model.
The equation below shows the second-order quadratic regression formula

Where y is the predicted response variable and x is the measured predictor variable. a, b and c are regression coefficients that the quadratic regression calculator found. In our example above, a = 0.81, b = -50.06, and c = 941.2.
General Form of the Quadratic Regression Equation
The general form of the quadratic regression equation looks like the following.

We can get really fancy and use some math symbols to rewrite the quadratic regression equation as

In the quadratic regression equation, we never multiply the values of a_i together. The value for y is actually a linear equation because we never multiply different values of a and x.
Statisticians sometimes call quadratic regression linear regression. Because finding a quadratic fit means solving a set of linear equations. But the general public often calls this quadratic regression because we are fitting a quadratic function to the input data points.
What Is the Difference Between Quadratic Regression and Multiple Linear Regression
Quadratic regression is used to find a quadratic line of best fit for one response variable based on one predictor variable. Statisticians sometimes call this a form of simple linear regression because there is one predictor variable, one response variable and the regression equations are linear.
Multiple linear regression is used to find a line of best fit for one response variable based on the values of one or more predictor variables.
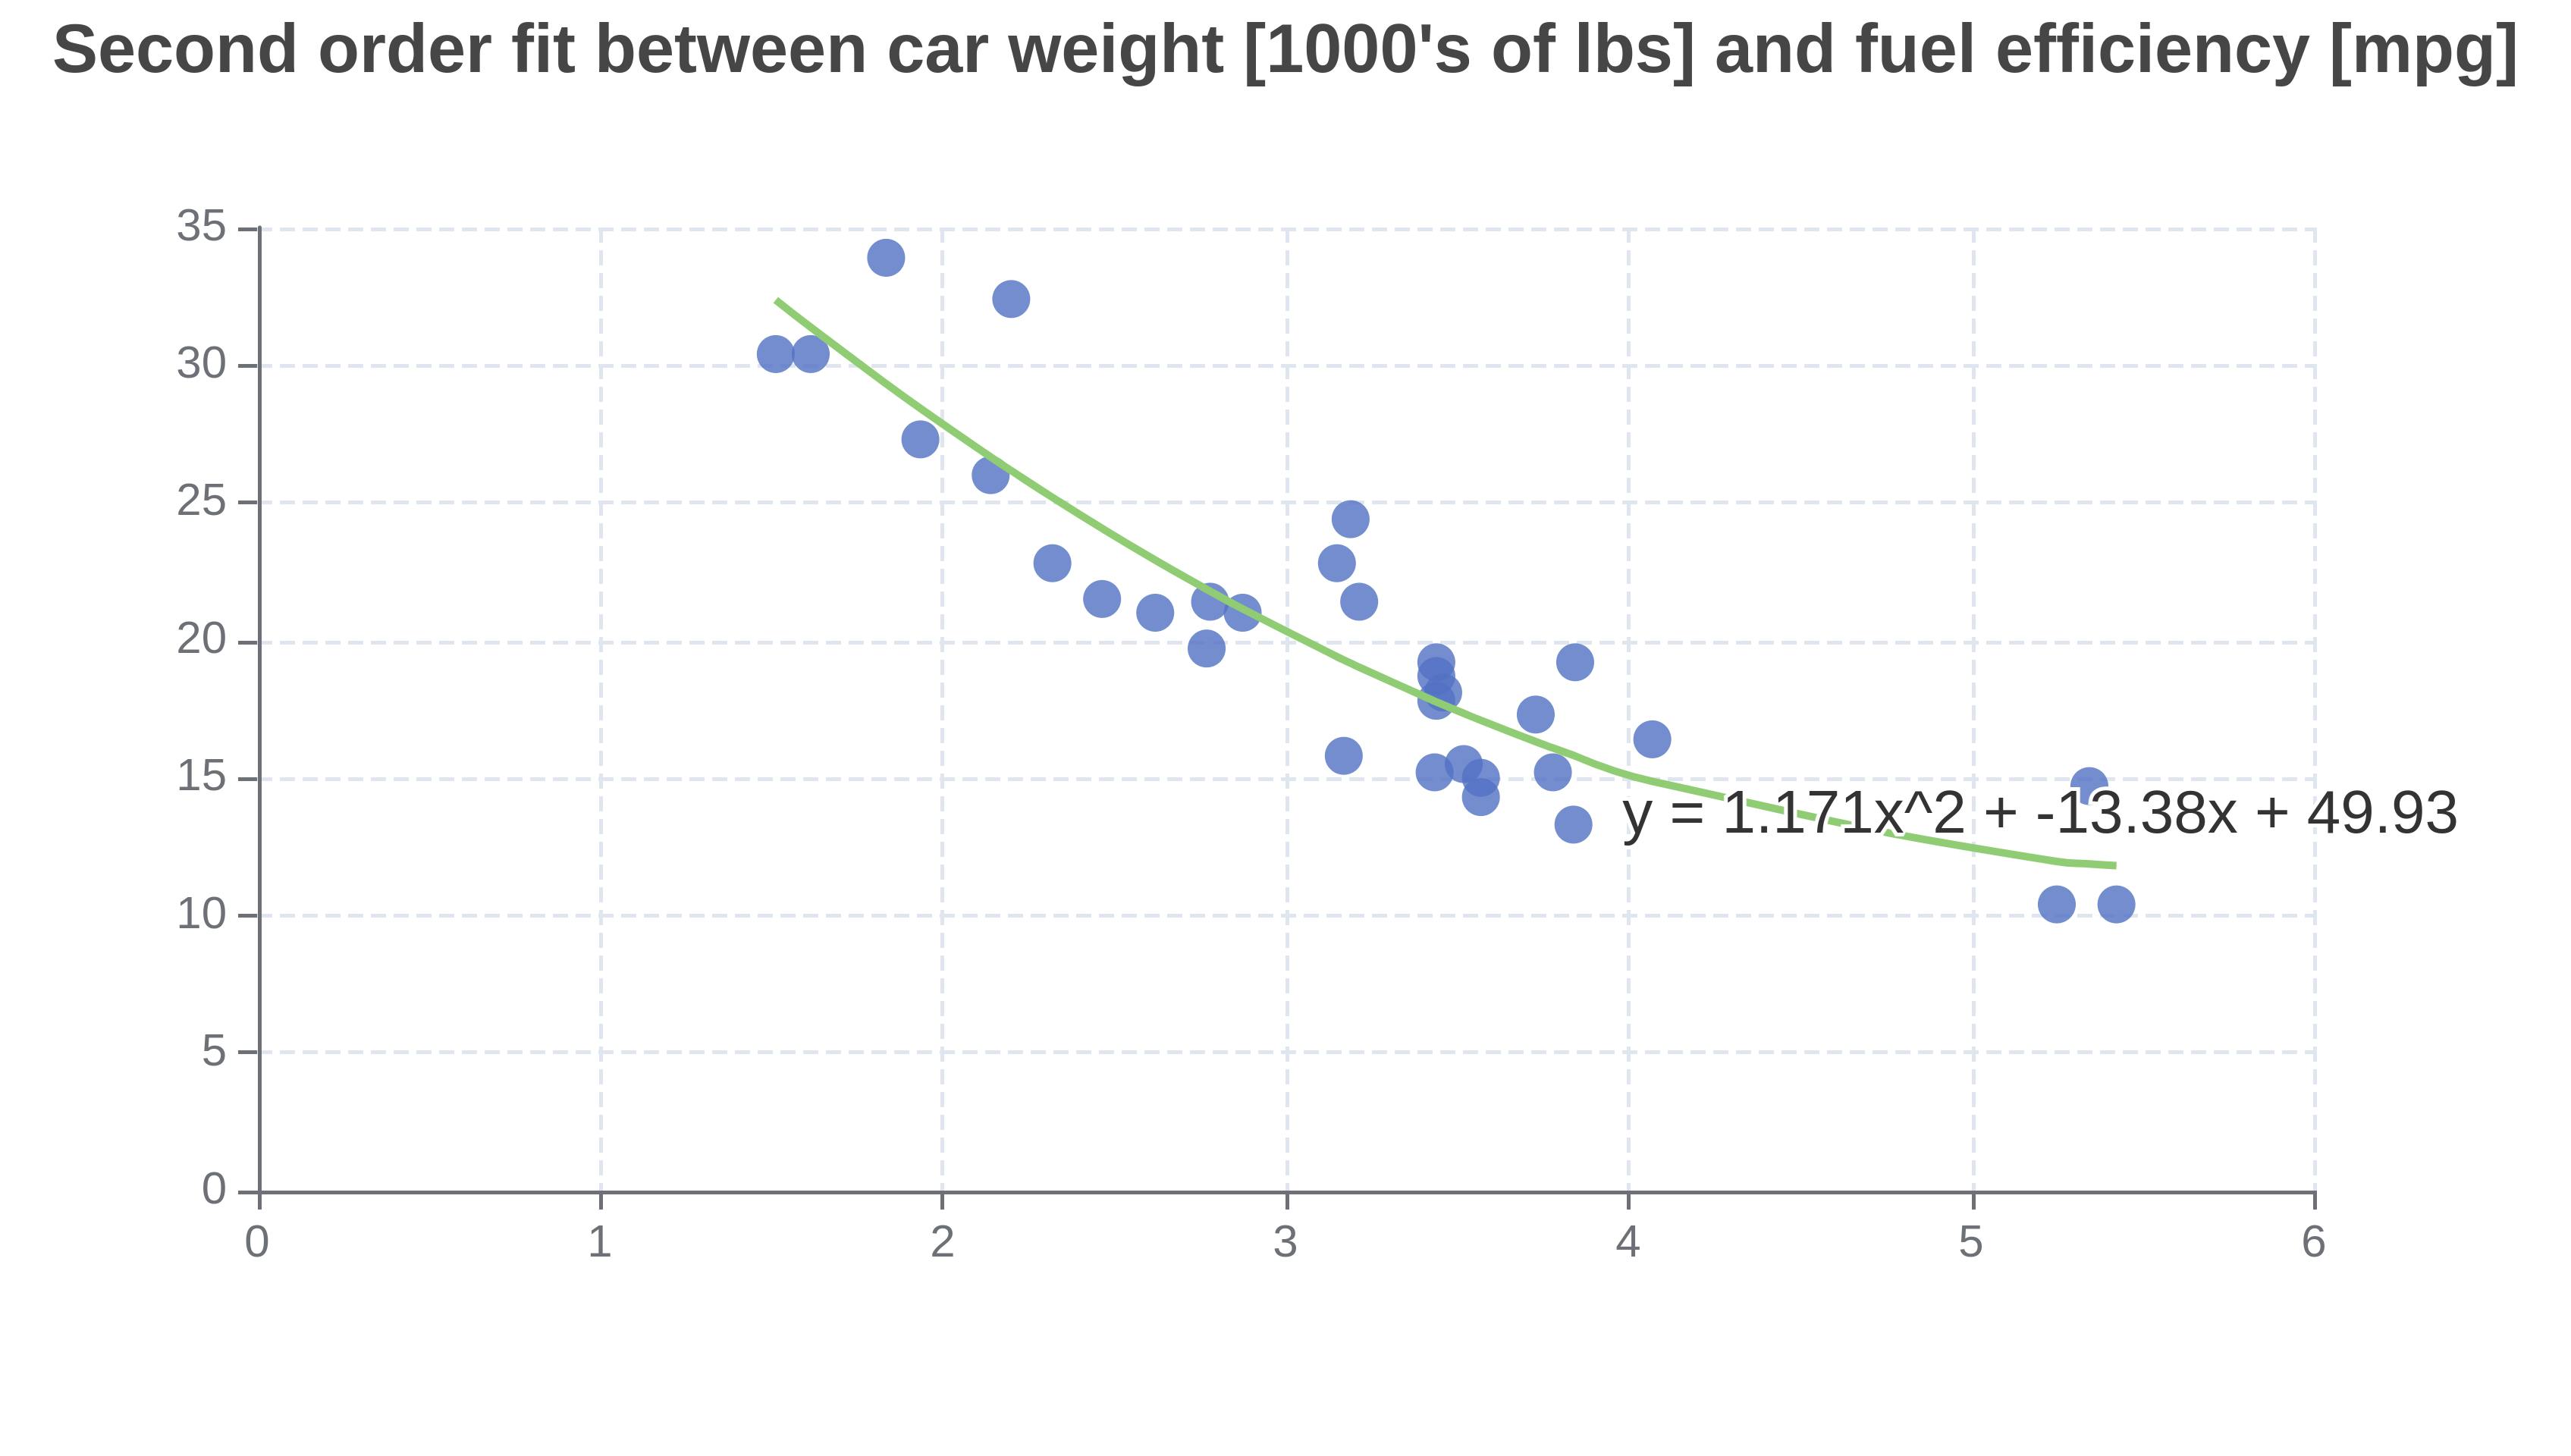
You could model a car's fuel efficiency based on its weight using quadratic regression. You could model a car's fuel efficiency based on its weight and its horsepower using multiple linear regression.
What Is the Difference Between the Correlation Coefficient and Regression Fit
The correlation coefficient is used to measure how strong the linear relationship is between two variables. It is a number between -1 and 1.
Quadratic regression is used to fit a function to the relationship between input x and y values.
If two variables have a non-linear relationship (e.g. they are best fit with y=x^2), then the quadratic regression calculator might find a good fit, but the two variables might have a poor Pearson's correlation coefficient.