Sharing helps us build more free tools
Area graphs are useful for showing relationships between numeric variables. They are similar to line charts, but the area under the line has a solid fill.
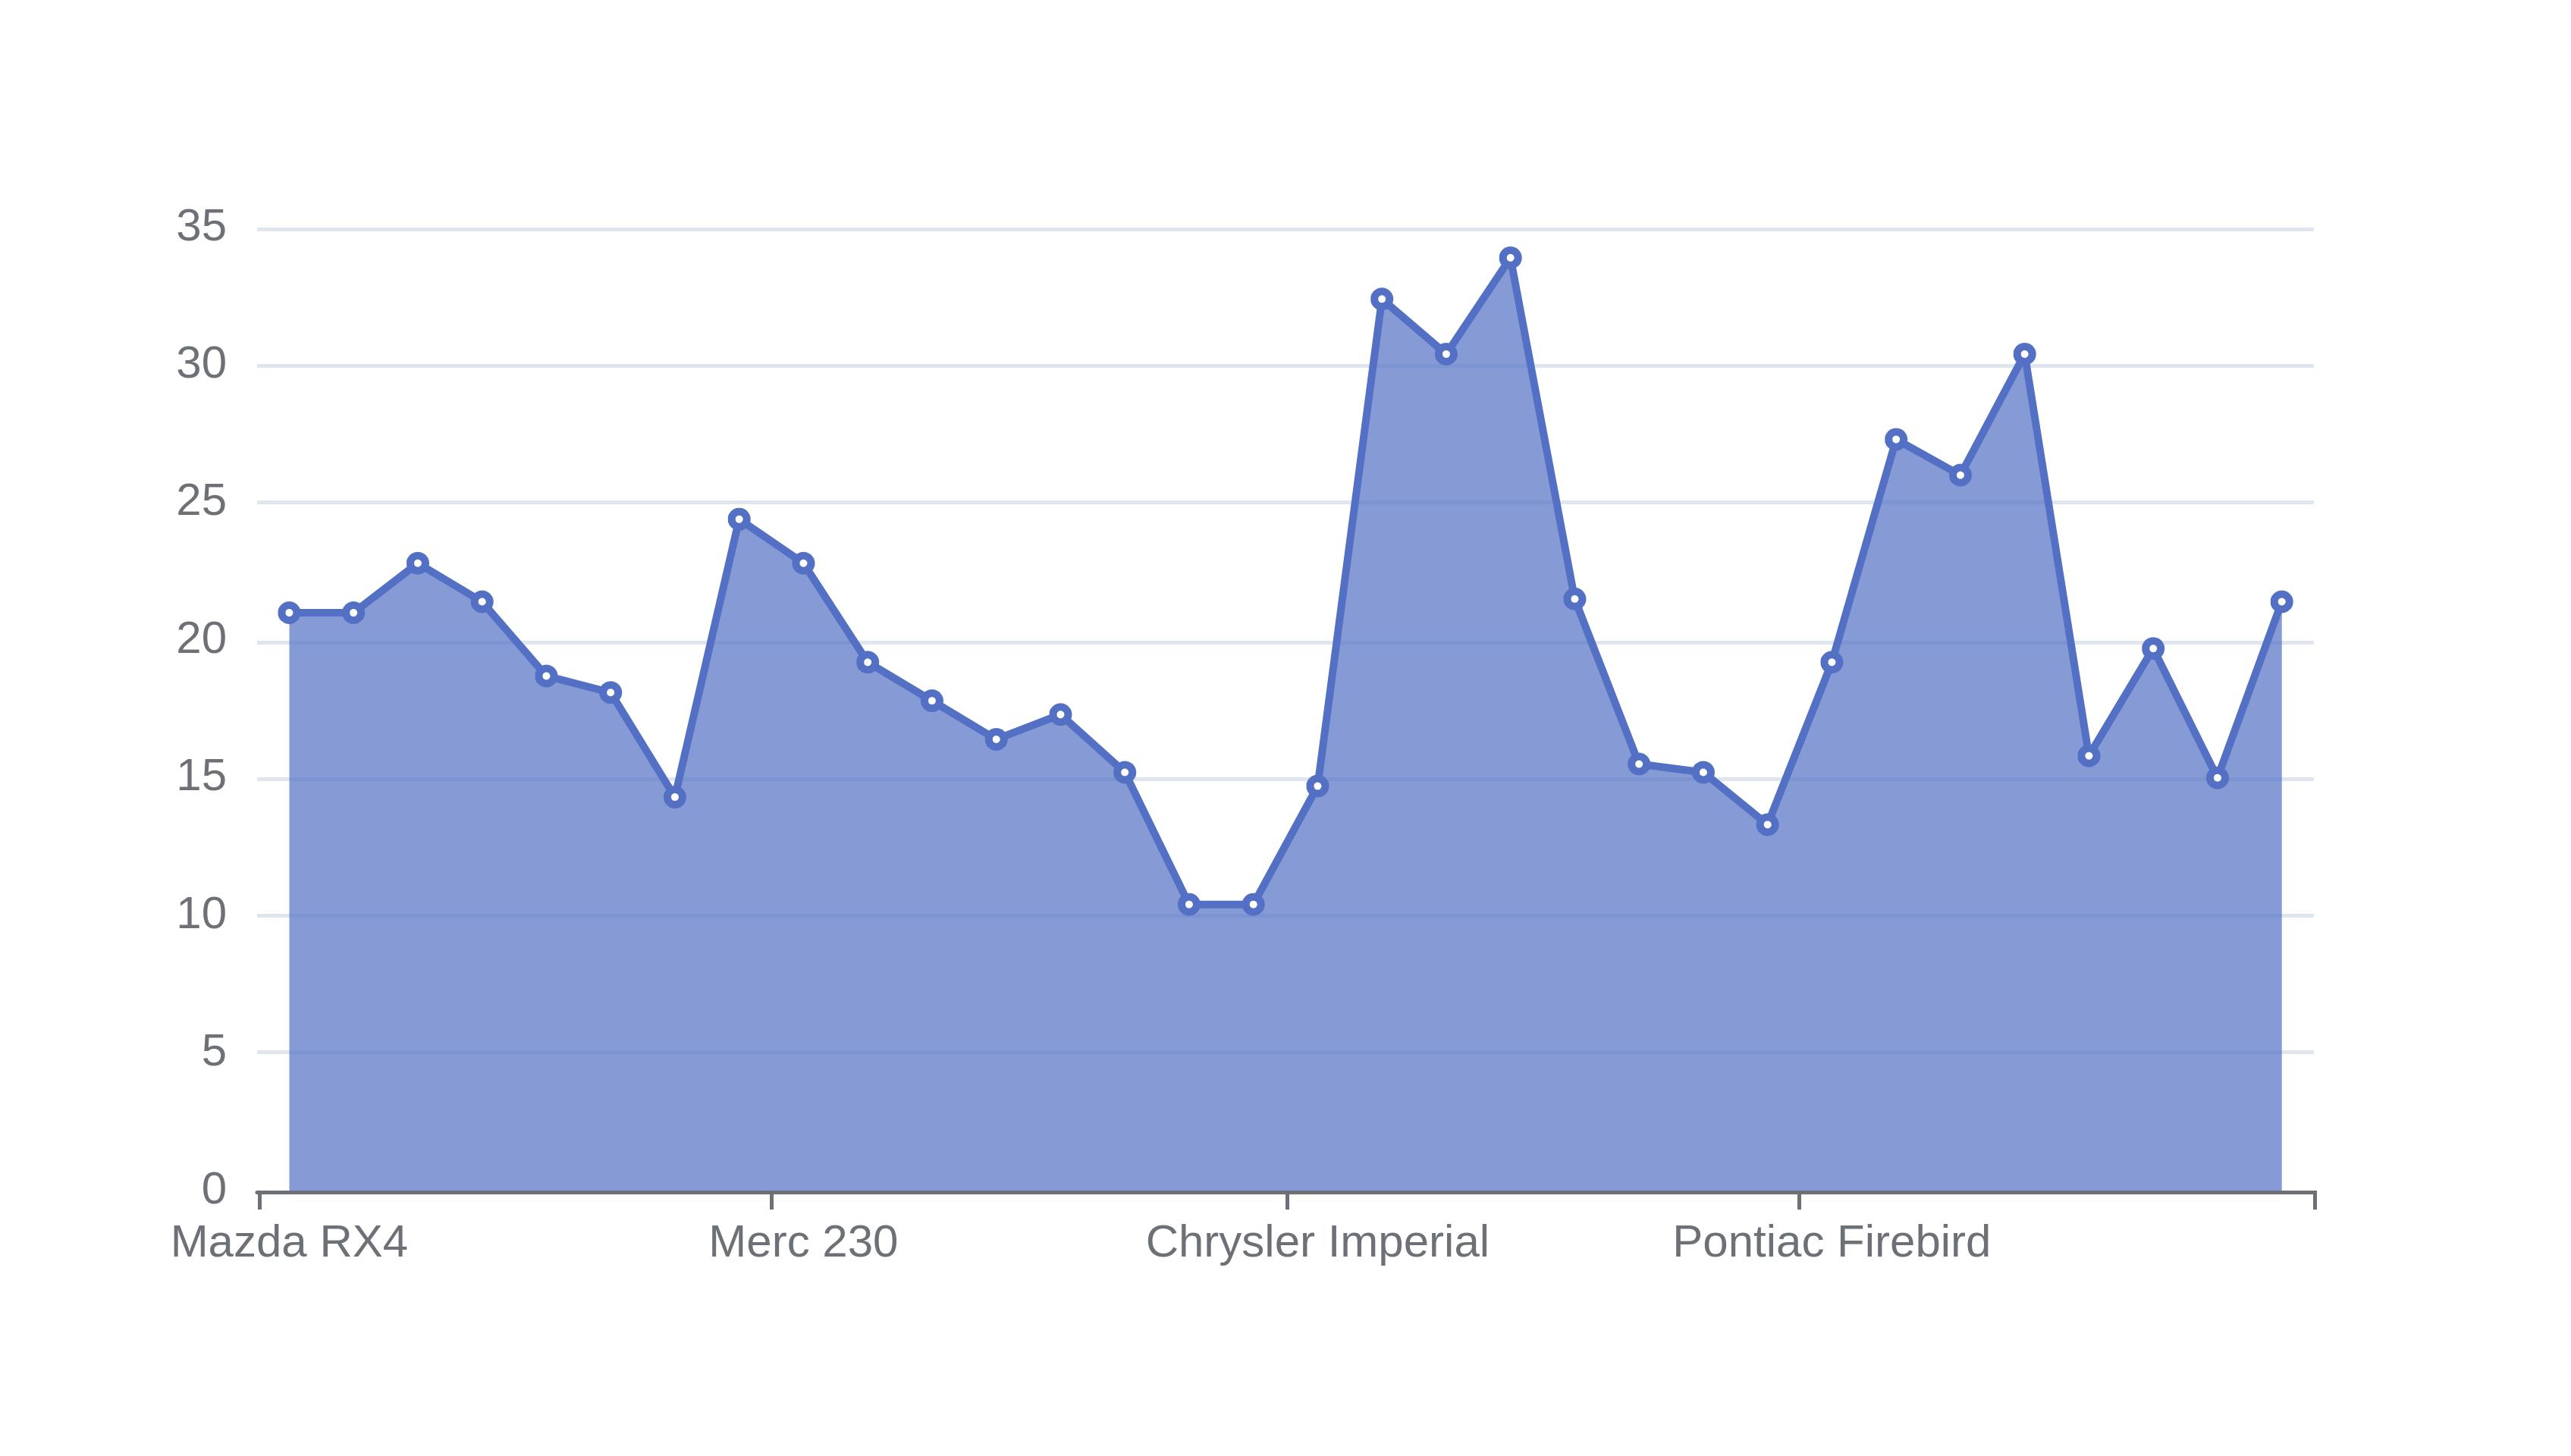
When To Use an Area Graph
An area chart can be used in similar situations to a line chart or spline graph. They are useful for showing the relationship between numeric variables.
Area graphs are useful for presentations. The solid fill means that it is easier to see from a distance than a line graph.
Stacked Area Chart
A stacked area chart can be used instead of an area chart when there is more than one quantitative data series.
In stacked area charts the two series stack on top of each other. This is useful when the two data series are additive.
For example, a stacked area chart would be useful for plotting the reasons why different customers canceled their subscriptions.
Stacked area charts and pie charts can be used to view the part to whole relationships of a data set. Each vertical slice of data on the x axis shows the part to whole relationship of a data set, which can also be viewed with a pie chart.
This tool can be used to make an area chart. If you would like a feature added to make a stacked area chart then please click the feedback button.
How To Make an Area Graph
Upload your dataset
Click the dataset input at the top of the page. Or drag and drop your dataset into the input box.
Select the column for the horizontal x-axis
The value on the x-axis should be independant of the value on the y-axis. Pick a value for the x-axis that is not affected by the value you will use on the y-axis
Select the column for the vertical y-axis
Pick a value for the y-axis that depends on the value for the x-axis. This will help you see how the x values influence the y values
Download your area graph
Click the download button on the graph to download an image of your area graph