Sharing helps us build more free tools
The Pearson correlation coefficient is used to measure the correlation between two continuous variables. Continuous measures show the raw value of something e.g. the rainfall on a day. The difference between continuous measures has meaning, not just the ordering.
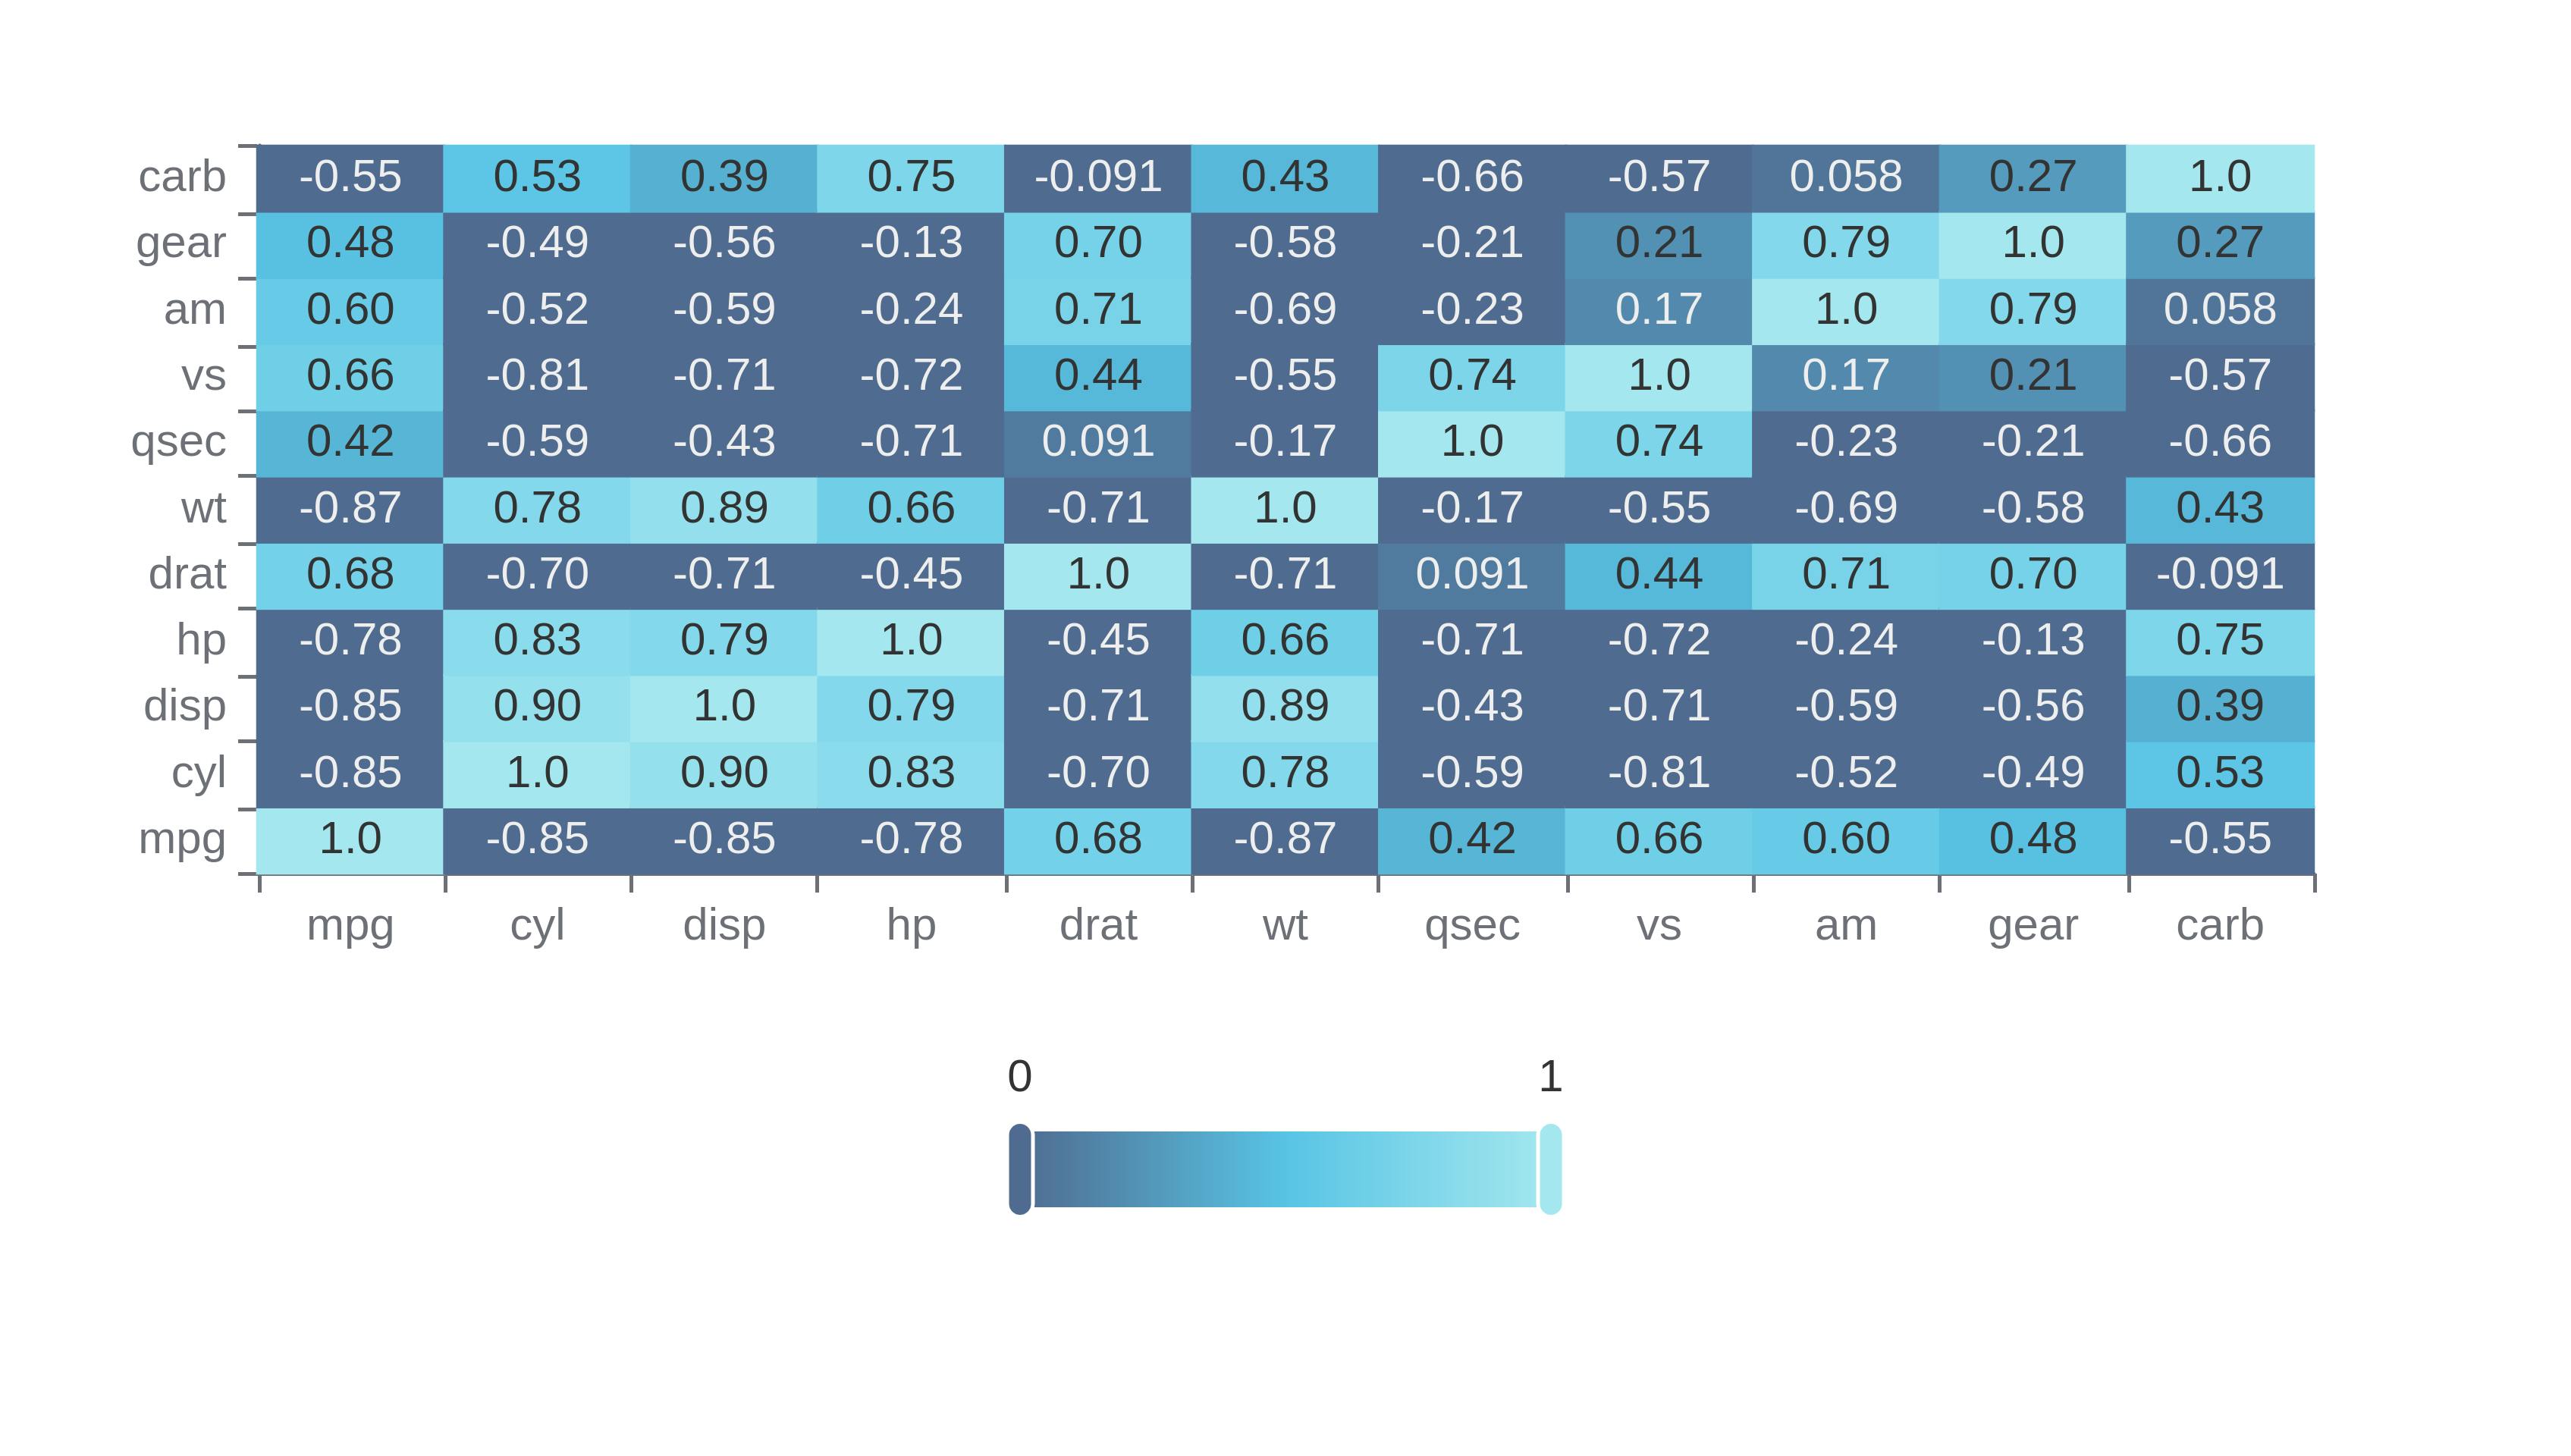
The heat map below shows Pearson correlation coefficients for columns in the mt cars data set.

When To Use Pearson Correlation
Pearson correlation is useful for calculating the correlation between continuous variables. The correlation coefficients can be used to figure out if changes in one variable relate to changes in another variable.
What do the Values of Pearson correlation mean
A Pearson's correlation coefficient close to 1 means that the two variables have a strong positive correlation. When one variable increases then so does the other. A correlation coefficient of 1 is a perfect positive correlation.
A Pearson correlation coefficient close to -1 means that the two variables have a strong negative correlation. When one variable increases then the other variable decreases.
A Pearson correlation coefficient close to 0 means that the two variables are not correlated.
How to Perform Pearson Correlation
Upload your dataset
Click the download button on the graph to download an image of your polynomial regression
View the Pearson Correlation for each column against each other column
A heatmap with the Pearson Correlation of each column against each other column will appear on the screen
Download Pearson Correlations
Click the download button on the graph to download an image of your Pearson Correlation