Sharing helps us build more free tools
Quickly make a pie chart for free with this pie chart maker.
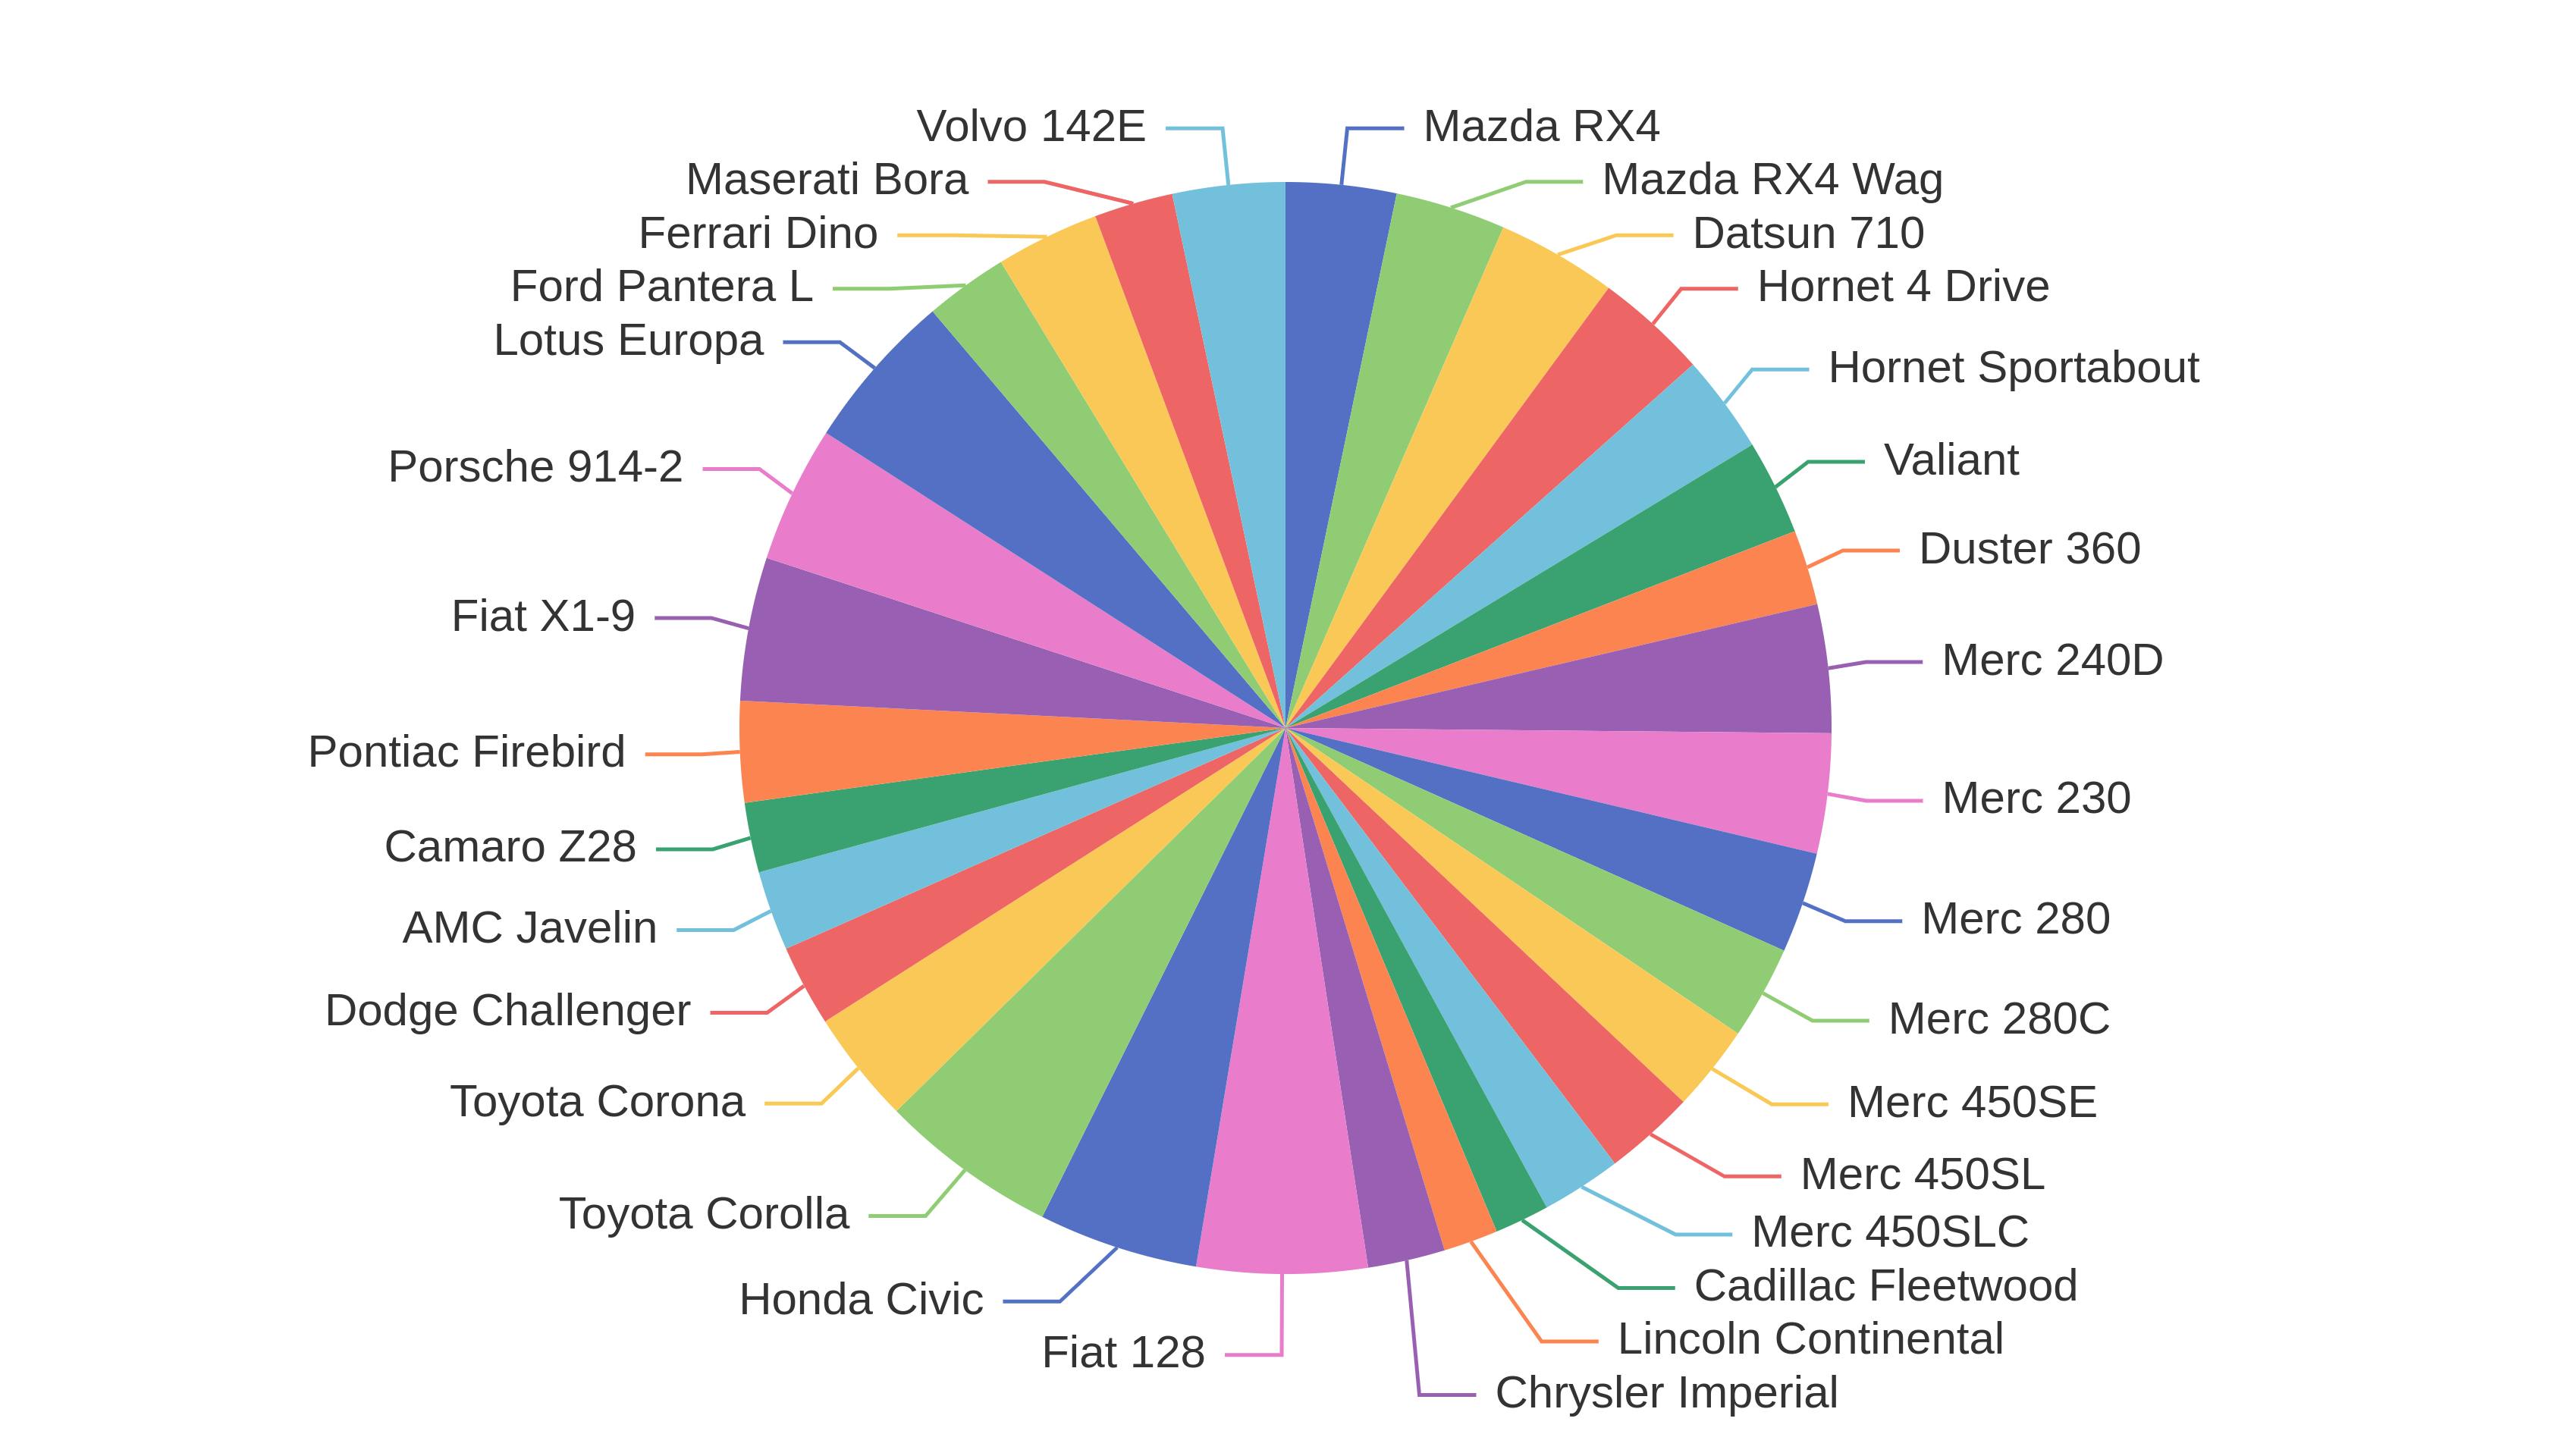
Pie charts show how different groups contribute to a total. They can be used to break down important data points to see the main contributors. The data labels for each slice are usually placed just outside of the pie chart.
When To Use a Pie Chart
Pie charts are really useful for viewing what percent each group of data contributes to a total. The slice angles represent percentages of each group.
For example, if you have an e-commerce store. A pie chart showing the number of sales from each product will show you what items bring in the most sales. This could allow you to figure out what products to focus on.
Pie charts are similar to donut charts (doughnut chart) and nightingale charts. These chart types all convey the same information about a data set but have different designs.
How To Make a Pie Chart
Upload your data set
Click the dataset input at the top of the page. Or drag and drop your dataset into the input box.
View your Pie Chart
A Pie Chart will appear on the screen. Hover over the slices to see the data labels. No design skills are required with this free pie chart maker.
Download your Finished Pie Chart
Click the download button on the chart to download an image of your Pie Chart. It's completely free.
What Are Some Different Types of Pie Charts
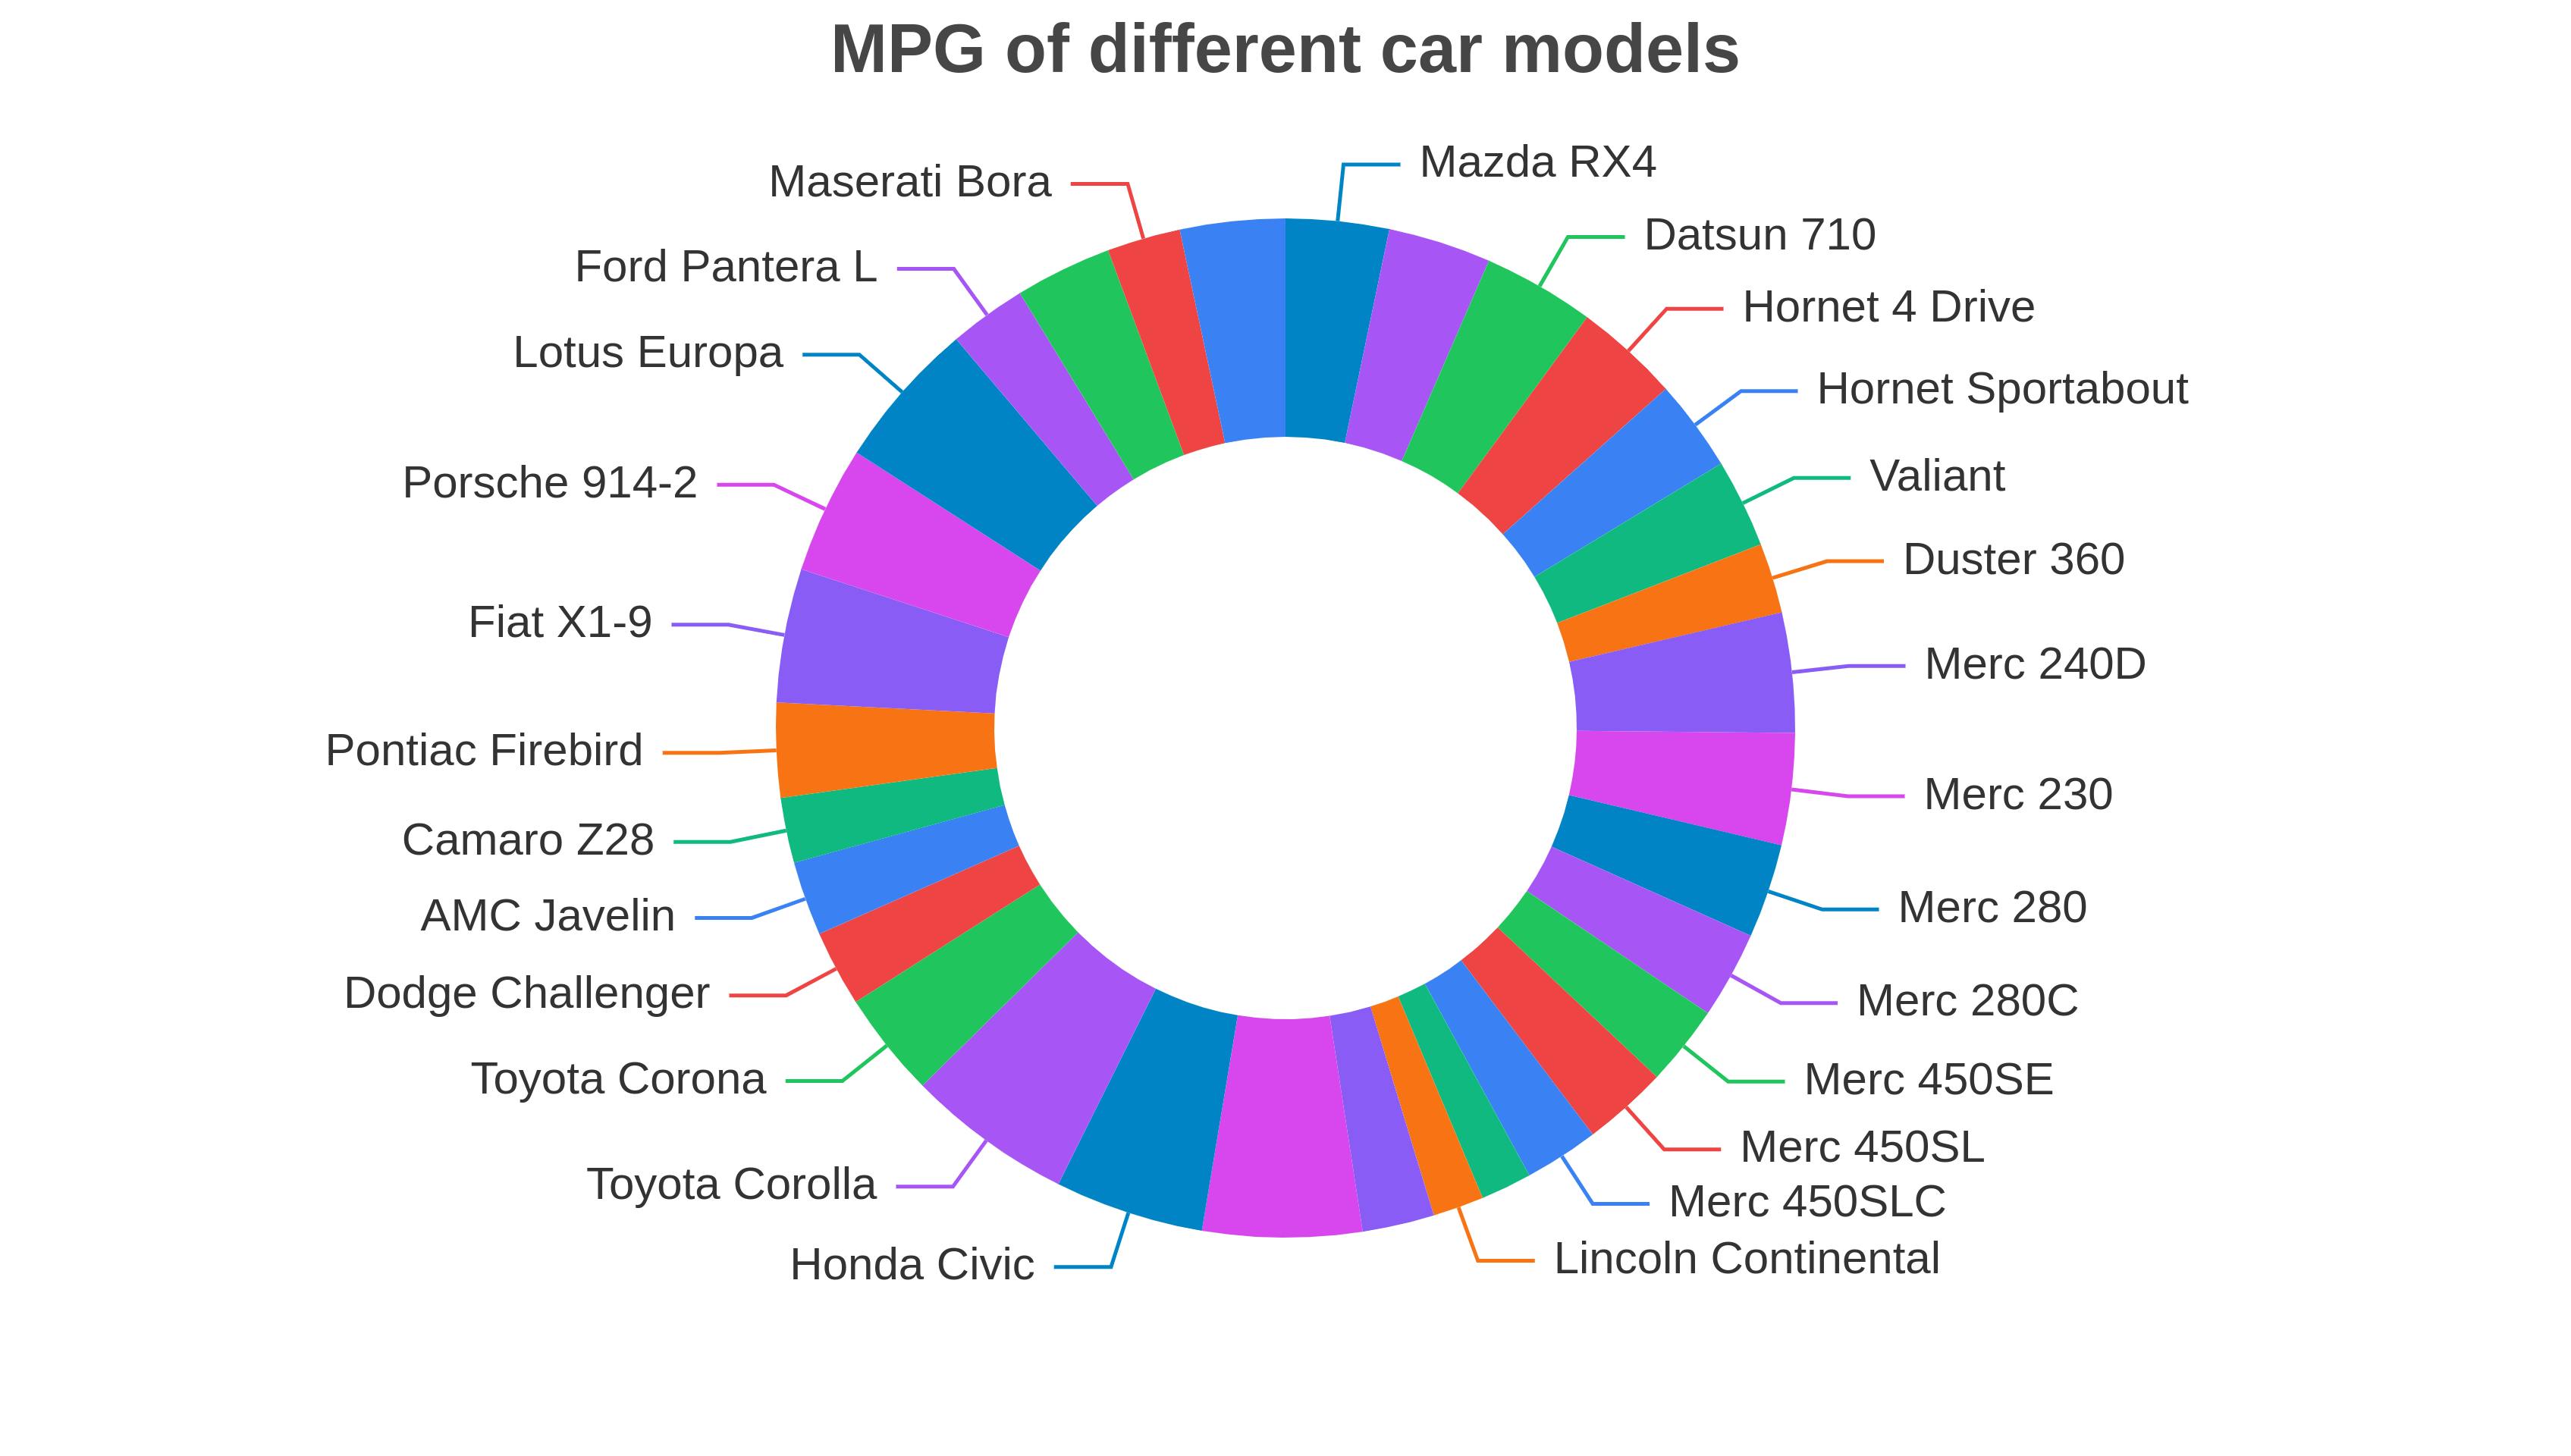
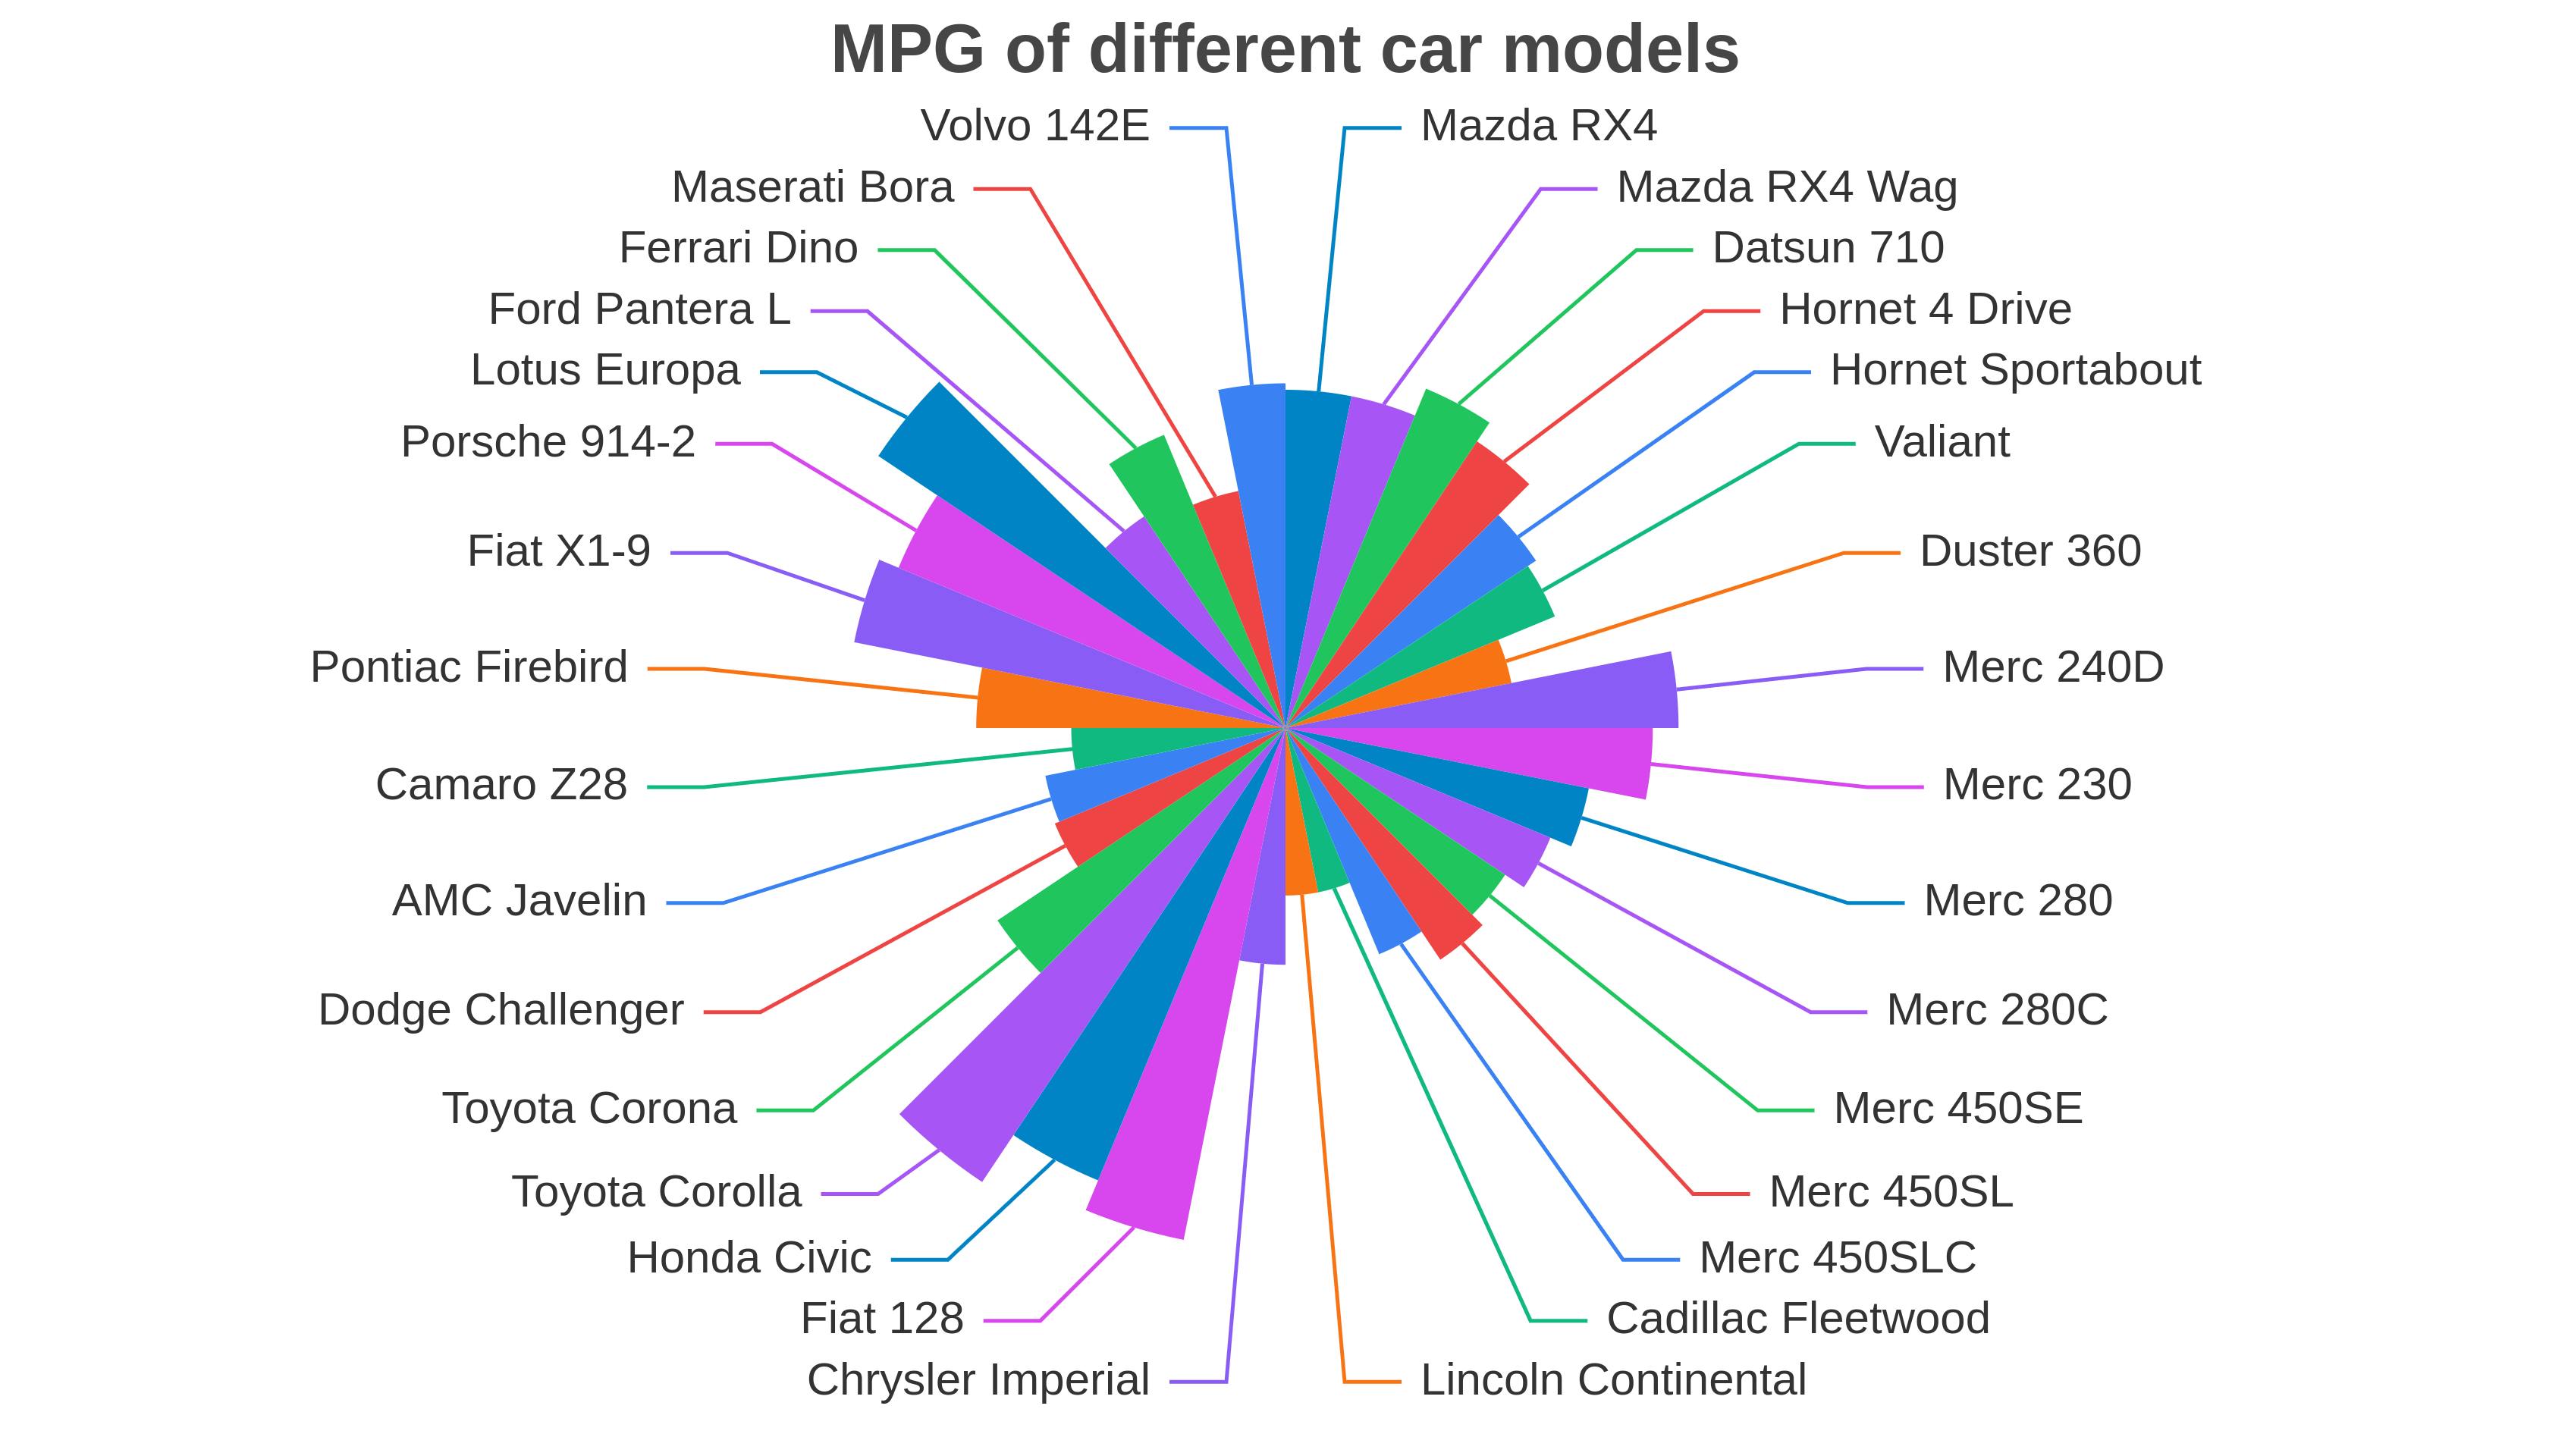
Donut charts and Nightingale charts are different types of Pie Charts.
Donut charts are similar to pie charts, except they have the middle cut out.
Nightingale charts add extra emphasis to big slices of a pie chart. This can also make them misleading.
Why Should I Use This Pie Chart Maker Instead of Using a Spreadsheet
The Pie Chart Maker makes it really easy to create your own pie chart. It can be more difficult to use a spreadsheet to create pie charts, even when using pie chart templates.
After you upload your data to this pie chart generator, you can change the properties that you want to plot, and the chart will automatically update. This makes it quick to explore your data and create a custom pie chart.
You can download your pie chart by clicking the download button. The pie chart generator will then create and download a png image of your pie chart. The image can be used with other design assets to share data in a presentation.
Do I Need to Start With a Pie Chart Template to Use the Pie Chart Maker
This pie chart maker lets you create pie charts without using a pie chart template. Just upload your data and click the name and value columns to update your pie chart.
The pie chart maker will recalculate the pie chart based on the input data points automatically when you change the inputs.
If you want to set a title for your pie chart, you can add text to the title box. Text will appear above your pie chart as you type.
Can I Use the Pie Chart Maker With the Rest of My Project
If you are logged in and upload a dataset, the dataset will automatically be uploaded to your existing project. You can even create a pie chart while your data is uploading in the background.
You can easily create a pie chart from an existing dataset if you come back later. Just click “explore” button on a dataset on the datasets page.